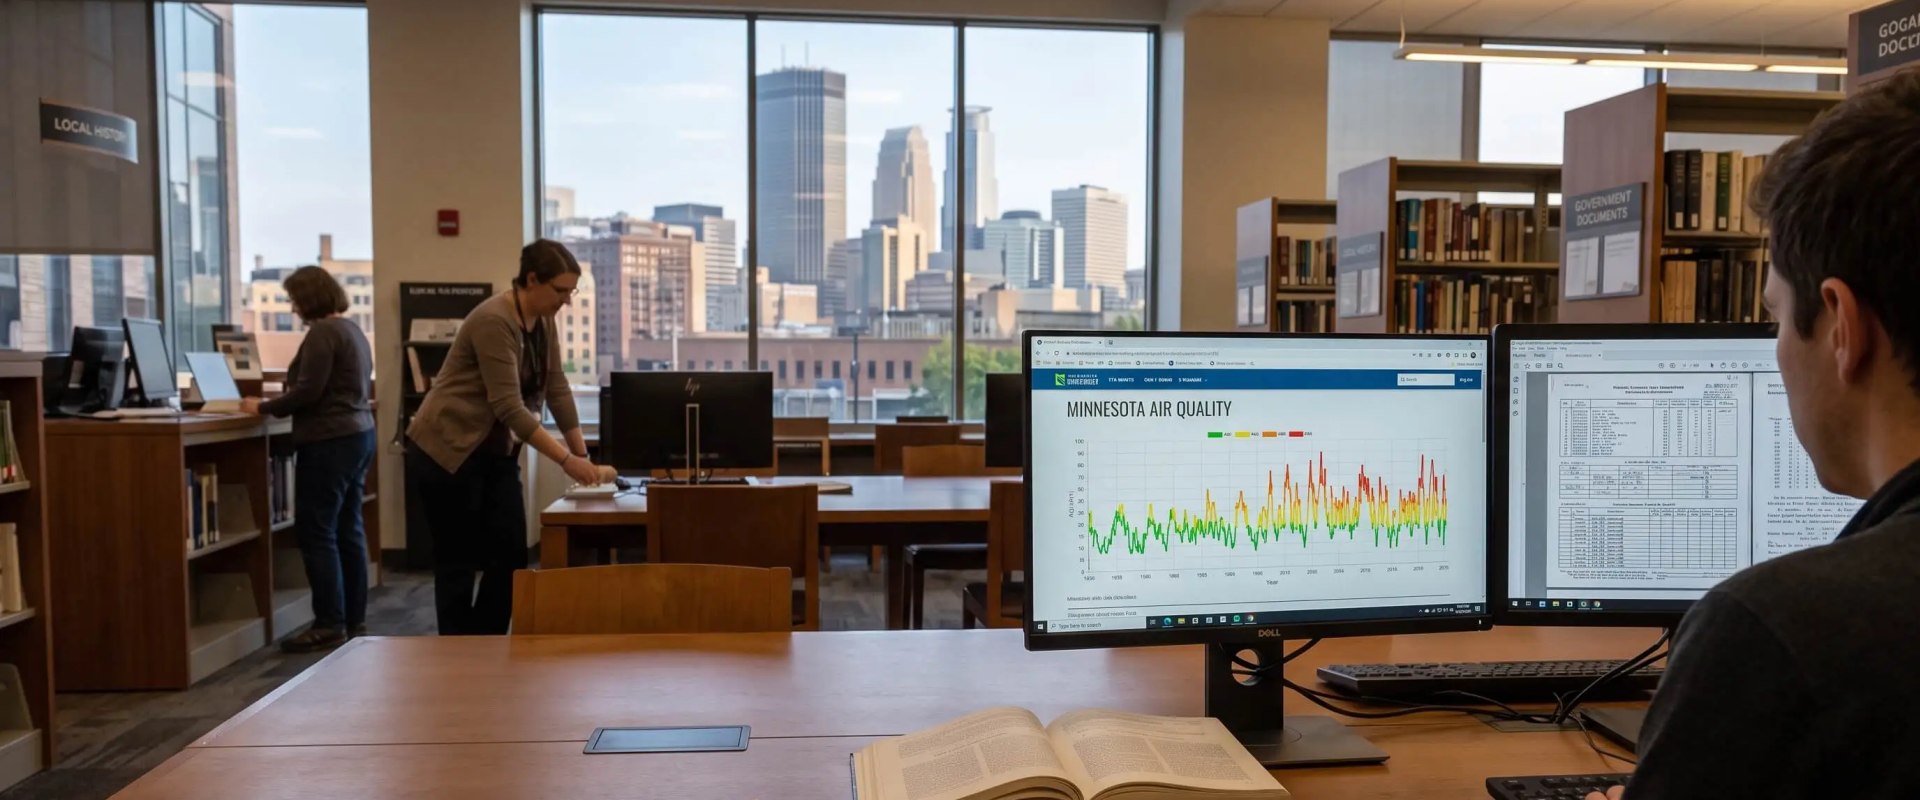
In July 2026, the Minnesota Pollution Control Agency raised air quality alerts across the Twin Cities to maroon, the Hazardous level, for the first time ever. Don't take your indoor air for granted after a week like that! Every orange afternoon that led up to it sits in free public records, and you can open them tonight.
Historical AQI data for Minneapolis lives in three places: the MPCA's past AQI tool, the EPA's AirData reports, and the City of Minneapolis air monitoring dashboard. Each one answers a different question. Read together, they show how the air over the Twin Cities has changed from one year to the next.
Here's something that might surprise you. The long-term trend is mostly good news, yet the last few summers set records nobody wanted. I went digging through these archives after one smoky July to find out whether it was a fluke. It wasn't. Once you know the pattern, you can protect the people under your roof before the next round rolls in.
The Air Quality Index turns pollutant readings into one number from 0 to 500, sorted into six color categories. Fine particles, known as PM2.5, and ground-level ozone drive almost every reading in Minneapolis.
TL;DR Quick Answers
AQI Minneapolis
AQI Minneapolis readings use the EPA’s 0 to 500 scale, and fine particles and ground-level ozone drive nearly every number. Check the MPCA or AirNow map for today’s value and EPA AirData for past years. Don’t take your indoor air for granted once the reading passes 100.
Green and Yellow, 0 to 100: Fine for most people. Unusually sensitive people should watch for symptoms.
Orange, 101 to 150: Kids, older adults, and anyone with asthma or heart disease should cut back outdoors. The MPCA issues air quality alerts at this level.
Red Through Maroon, 151 to 500: Everyone should limit time outside. In July 2026, the Twin Cities reached maroon, the Hazardous level, for the first time.
Peak Seasons: Wildfire smoke runs from late May through August, and winter inversions trap pollution on cold, calm nights.
Inside Your Home: Close the windows, switch the thermostat fan to On, and run a MERV 13 filter or the highest rating your system handles.
Past Readings: EPA AirData, the MPCA AQI tool, and the City of Minneapolis sensor dashboard store the history.
Top Takeaways
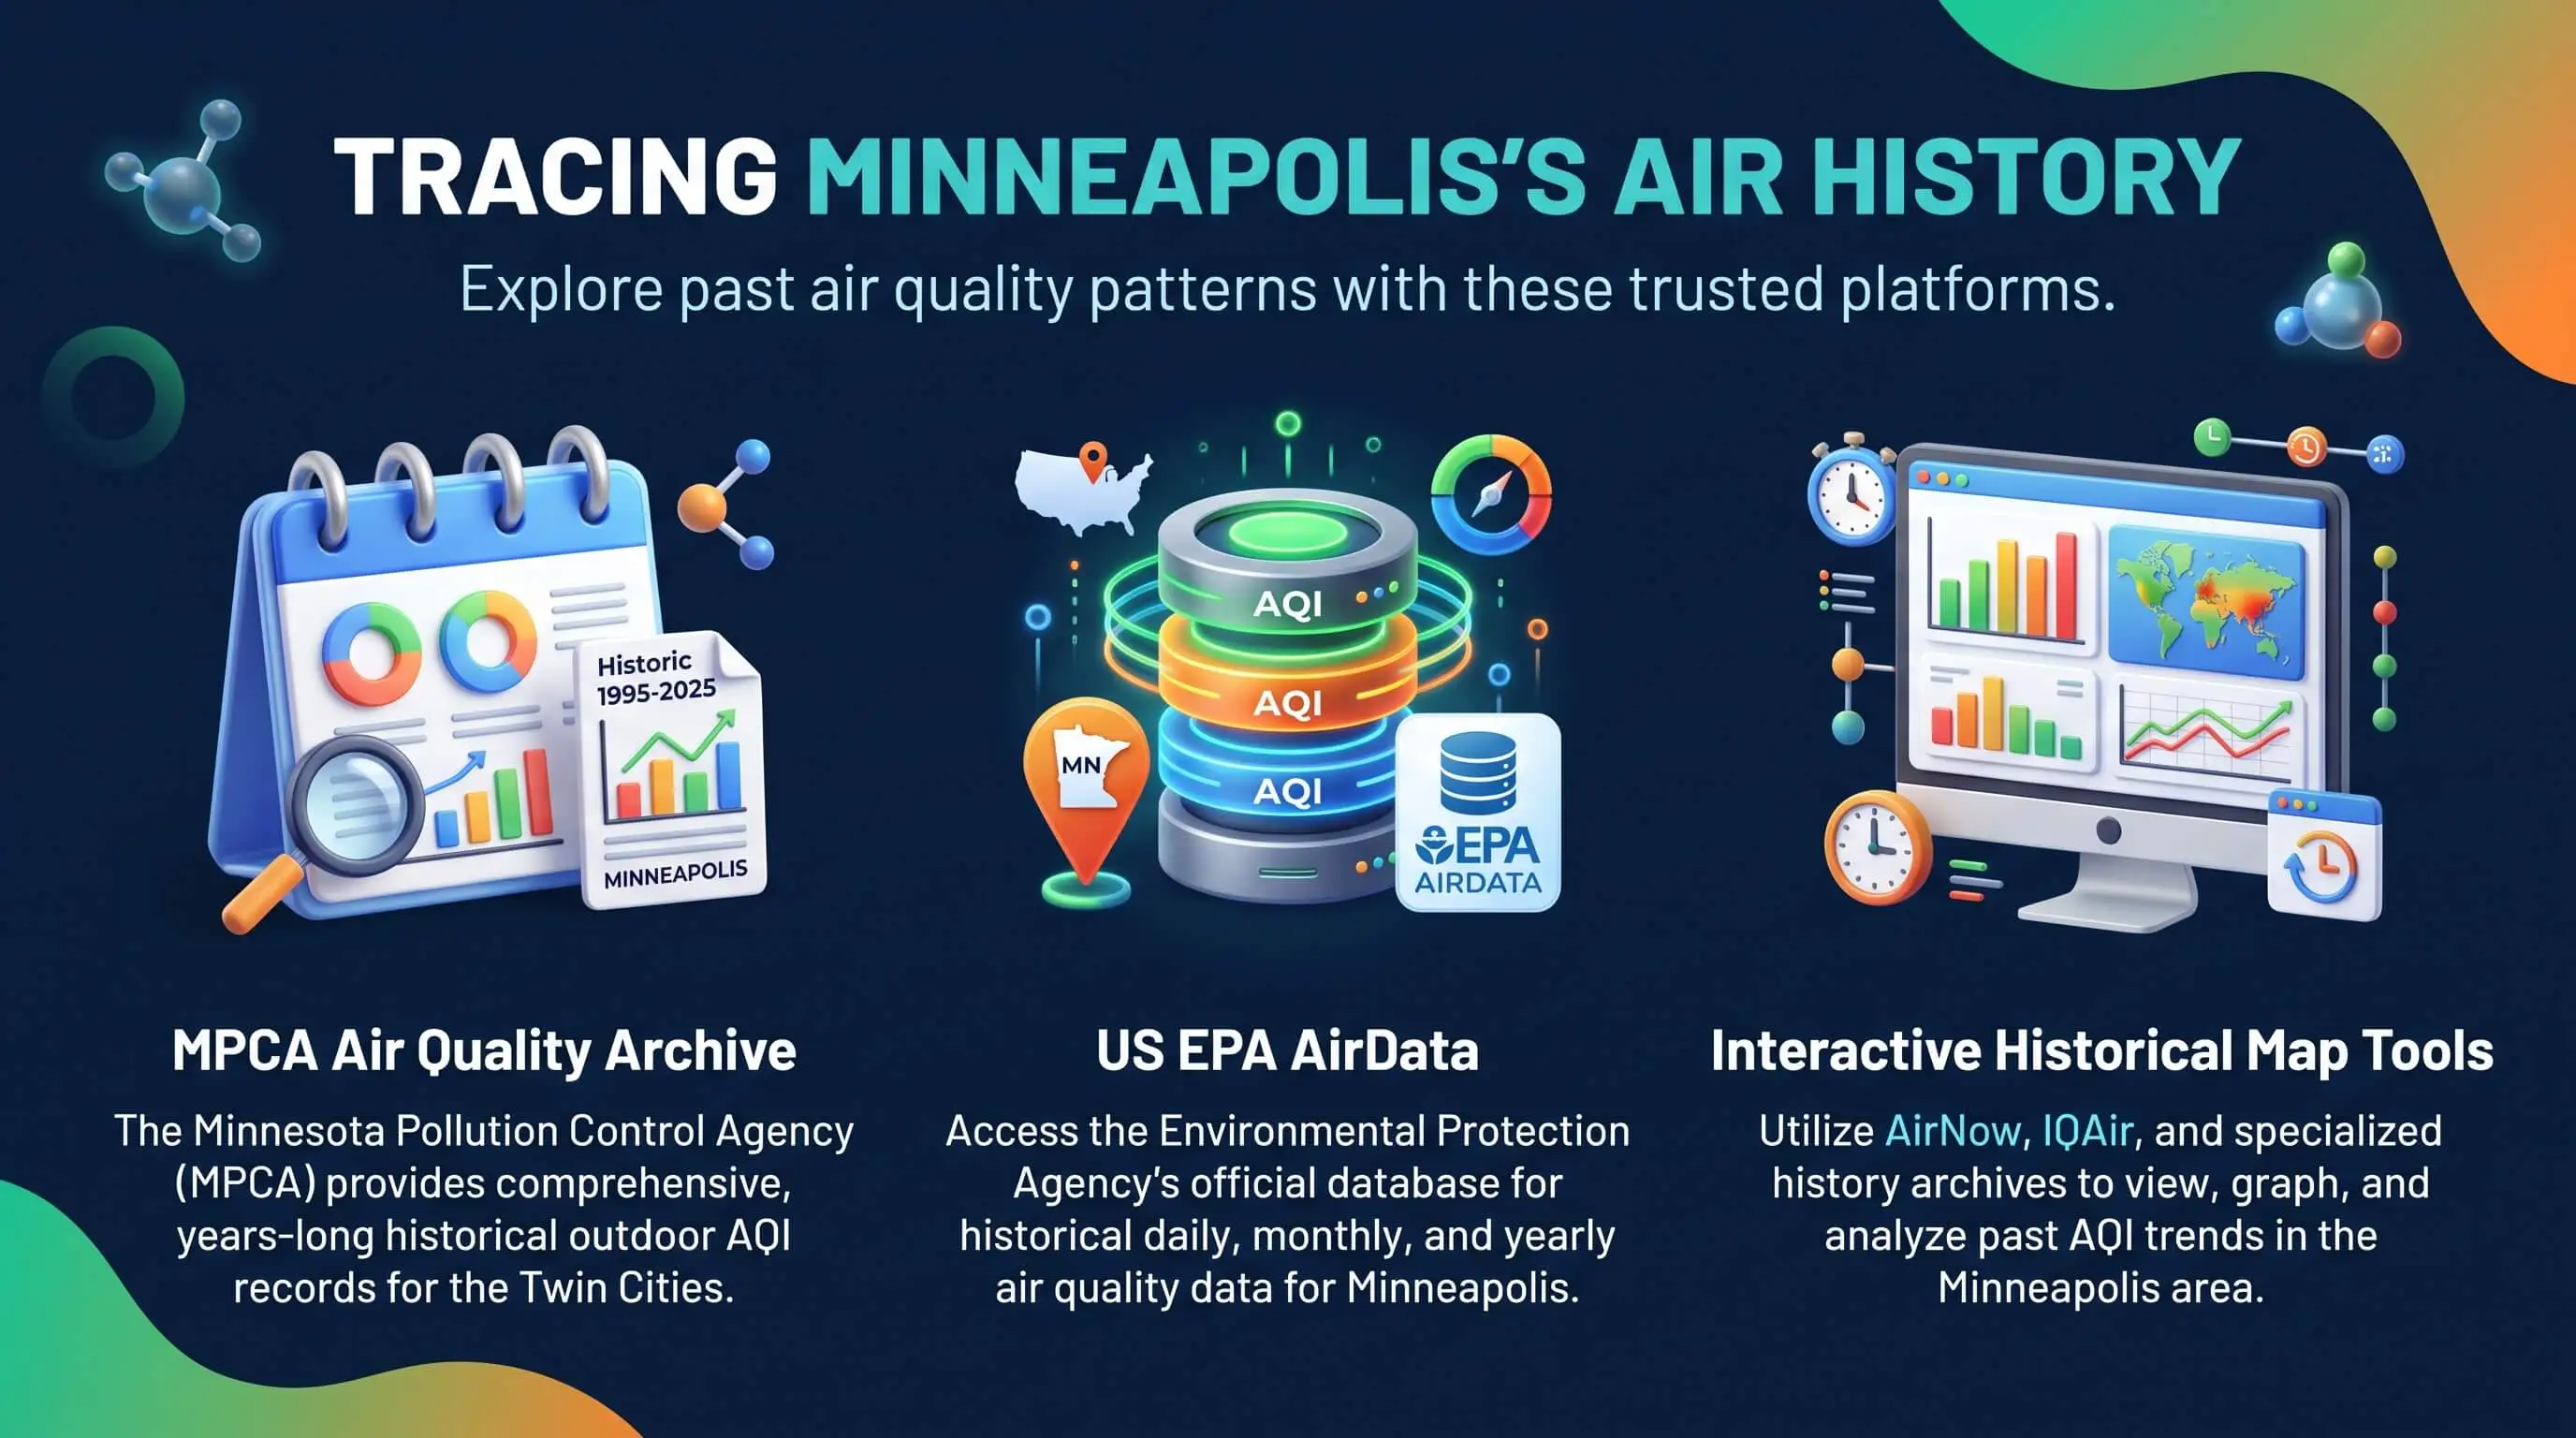
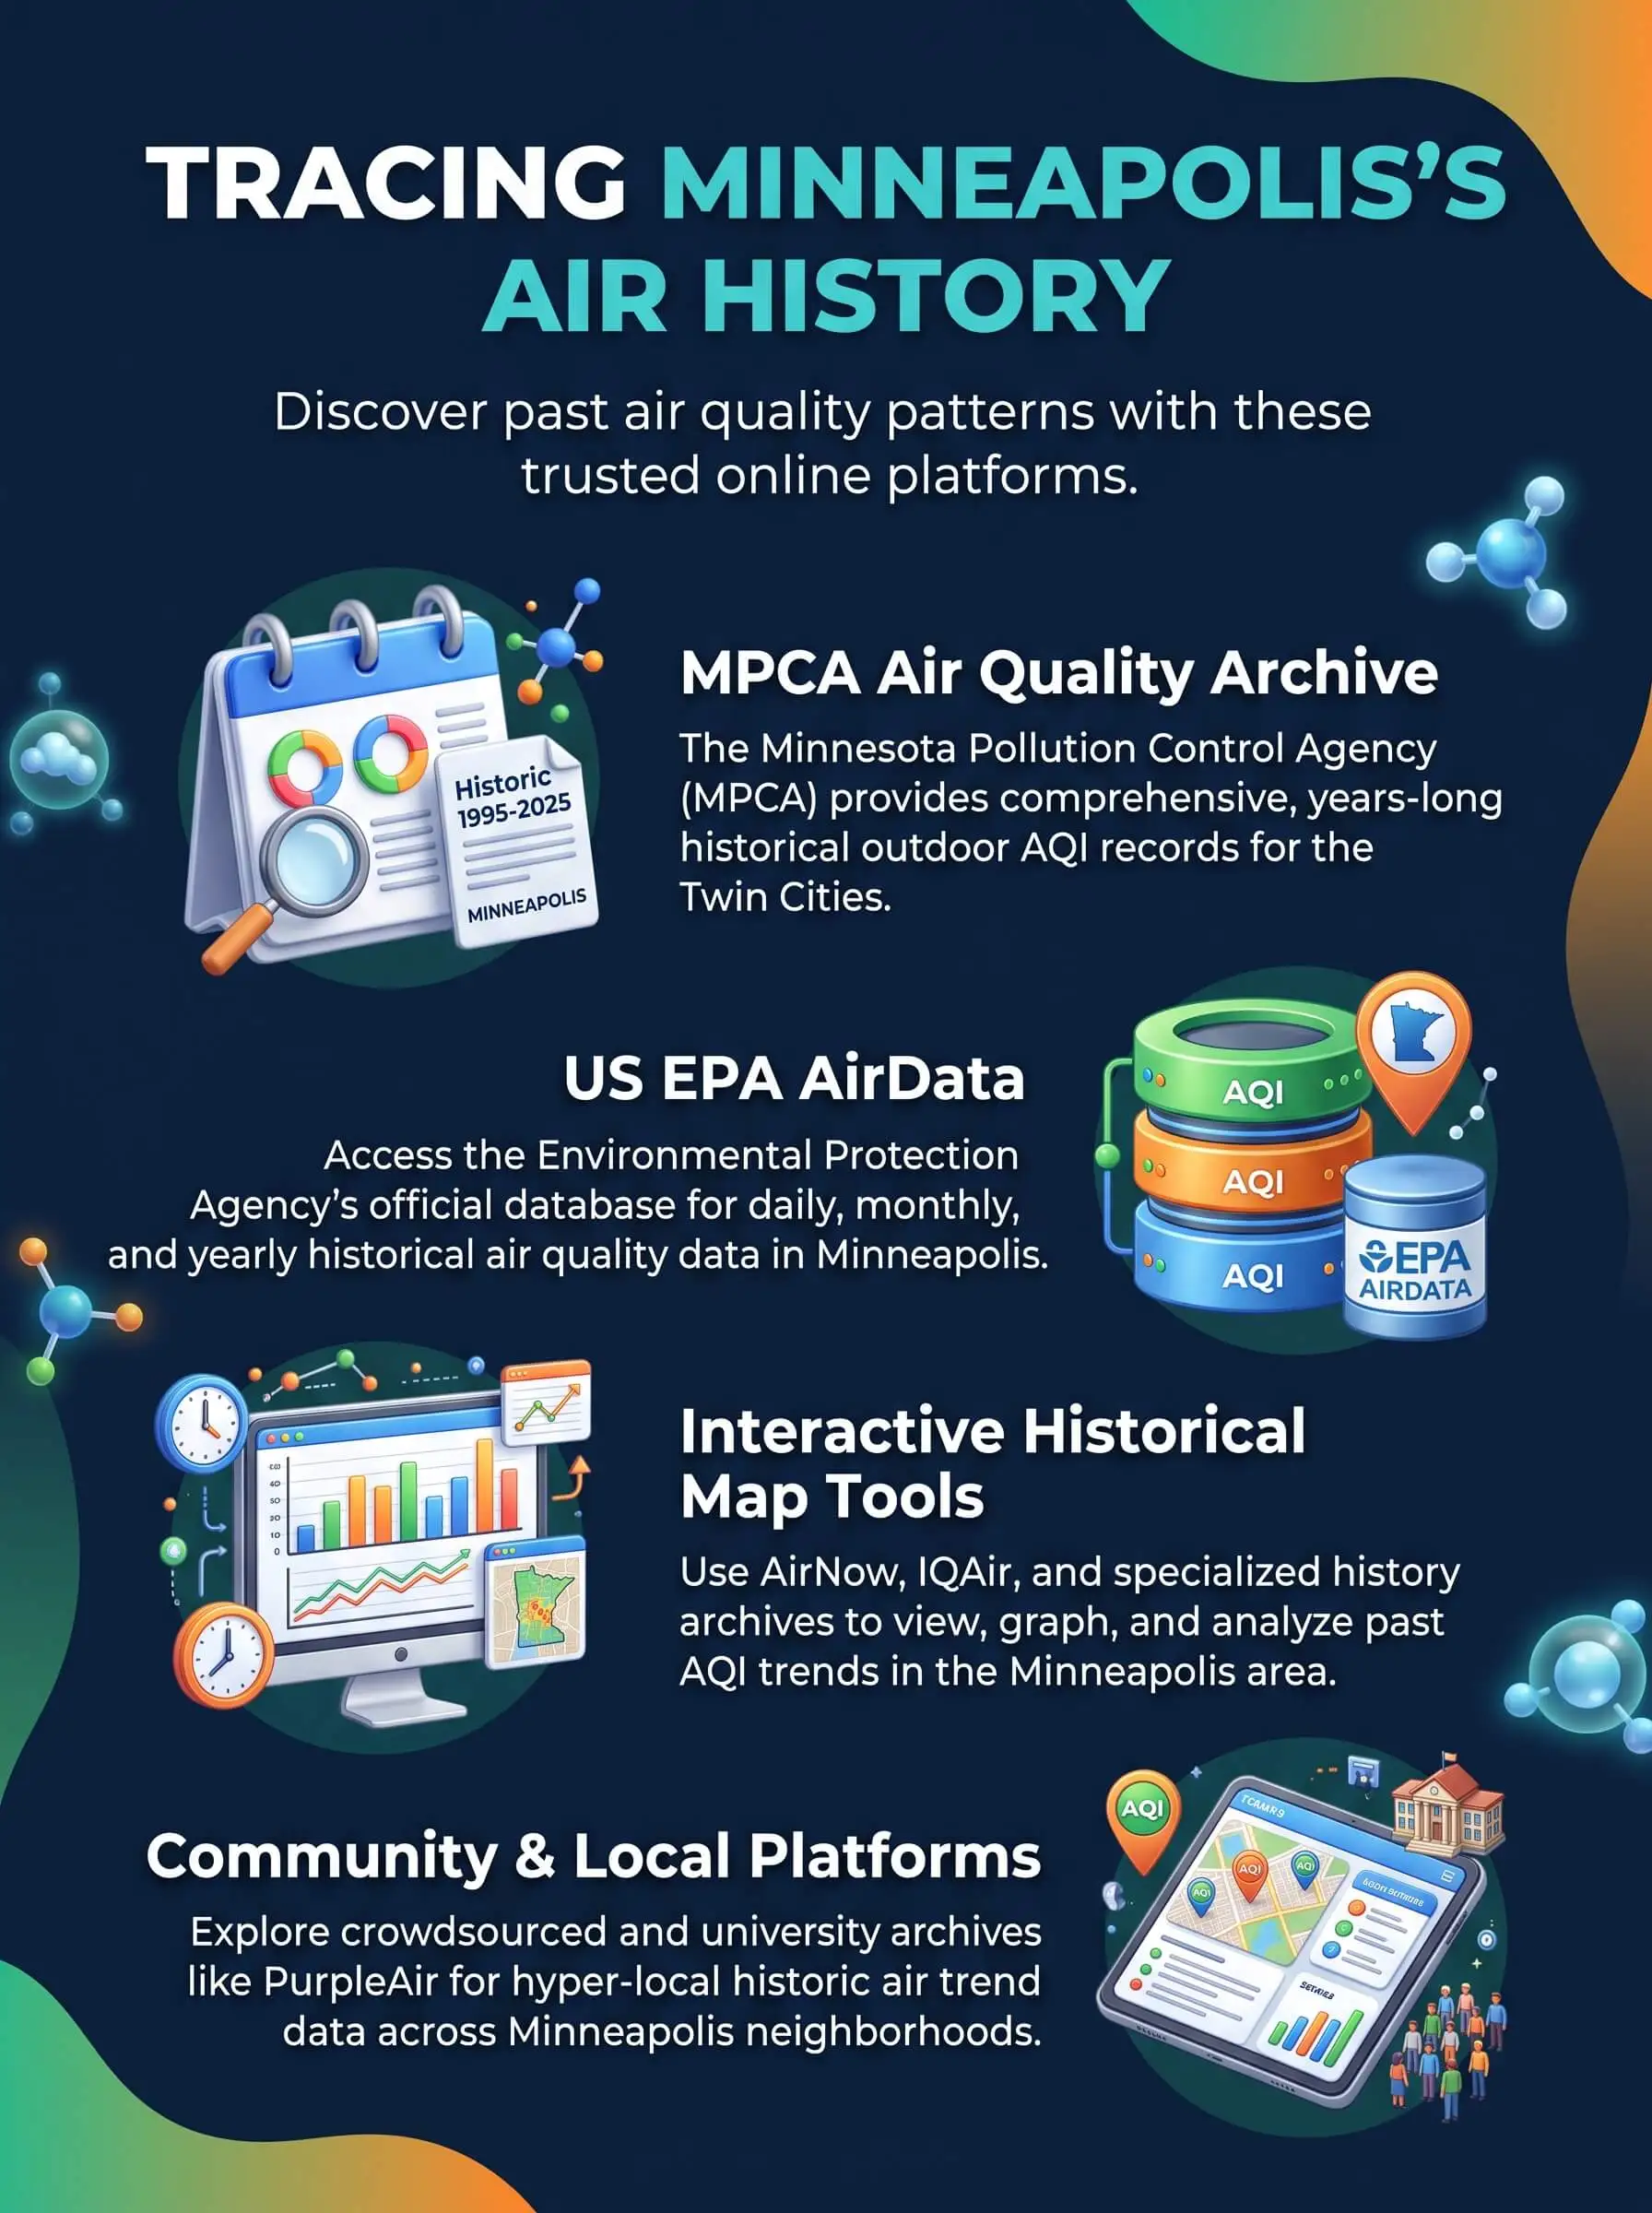
Three archives cover Minneapolis. The MPCA handles alerts and annual summaries, EPA AirData holds daily values, and the city dashboard tracks neighborhoods.
Everyday air keeps improving. Industrial and traffic pollution continue to fall.
The worst days keep multiplying. Alerts rose from 7 oranges in 2018 to 49 total in 2023.
Smoke writes the records now. Minnesota's 2025 season ranked as the smokiest in five decades, and July 2026 brought the metro's first hazardous alert.
Archive numbers need context. Daily values, provisional data, and the 2024 PM2.5 change all shift comparisons.
History makes a good filter calendar. Install a high-efficiency filter before the month of your records flag.
Where Is Historical AQI Minneapolis Data Kept?
Match the archive to your question and you'll save yourself a lot of clicking.
MPCA Air Quality Index Tool and Annual Summaries
Start with the state's own records. The MPCA current air quality conditions page links to a past AQI data tool that shows the reported PM2.5 and ozone AQI at monitors across Minnesota. Right beside it, the agency posts annual summary reports comparing AQI counts and alert days by region and year. Wondering how many orange days the Twin Cities logged in a given summer? This is where you look.
EPA AirData Reports
EPA AirData goes deepest when you need a day-by-day record. Its Daily Values Report lists every daily AQI for one county or metro area in the year you pick, and the annual AQI report tallies the good, moderate, and unhealthy days for you. The most recent weeks come from AirNow, though, and those numbers stay provisional until certified data replaces them.
City of Minneapolis Air Monitoring Dashboard
The city runs its own sensor network, and its dashboard is the place for block-level detail. It covers summer 2022 to now, refreshes weekly, and filters by neighborhood and year. No other archive can tell you whether your corner of town ran worse than the metro average. Knowing the AQI meaning helps you read these local air quality reports and see how pollution levels differ across Minneapolis neighborhoods.
How to Pull a Year of Minneapolis AQI Data in Five Steps
Open the EPA Air Quality Index Daily Values Report from the resources below.
Pick a pollutant, or leave it on all AQI pollutants for the combined daily value.
Choose the year you want to study.
Select Hennepin County, or choose the Minneapolis-St. Paul-Bloomington metro area to cover the whole region.
Run the report, download the file, and count how many days landed in each color.
Pro Tip: Pull three summers back to back. Side by side, the orange and red days make the trend far clearer than any single year can.
What Historical AQI Minneapolis Records Reveal
A Cleaner Baseline With Spikier Summers
Most days, Minnesota's air beats what it used to be. The MPCA says today's air is safer than it was 30 years ago, and it credits steady cuts in industrial and transportation pollution. The bad days are another matter. The state issued 7 orange-level air quality alerts in 2018. By 2023 that number had climbed to 49, and 12 of them were red.
The Smoke Years: 2023, 2025, and 2026
Wildfire smoke drives nearly all of that change. Minnesota's State Climatology Office called 2025 likely the smokiest year in five decades, counting 15 summer days when at least one station hit red. The closest recent year, 2021, had nine. Then July 2026 went further still, as fires near the Boundary Waters pushed the MPCA to raise alerts to maroon, a level the agency had never issued for the Twin Cities.
Winter Inversions Still Show Up
Smoke doesn't tell the whole story. On cold, calm winter nights, a lid of warmer air traps wood smoke and exhaust near the ground, so a January week can post moderate readings with no fire nearby. The MPCA still ranks residential wood burning among the state's top sources of air pollution.
How to Read the Archive Without Misreading It
Archive numbers can trip you up if you read them like a live map.
Hourly and daily numbers differ. Live maps show the NowCast, an hourly estimate weighted toward the newest readings. Archives store 24-hour daily values, so a rough afternoon can shrink to a moderate day on paper.
One monitor isn't the whole metro. Metro reports usually take the highest monitor each day, so your neighborhood may have fared better or worse.
Provisional data moves. Recent AirNow values can change once certified data replaces them.
Alerts and unhealthy days count differently. A single alert can stretch across several days and a wide region. Tally them separately.
The PM2.5 scale changed in 2024. EPA lowered the top of the Good range for fine particles to 9.0 µg/m³. Older years can look cleaner than they would on today's scale.
What Past Smoke Seasons Mean for the Air Inside Your Home
The archive measures outdoor air, but fine particles don't stay outside. They slip in through gaps, doors, and fresh-air intakes, and you won't see them once they settle into your home. Your records do show when that pressure peaks in Minneapolis, with smoke events from late May through August and inversion weeks in midwinter. Plan around that timing. Proper duct sealing helps reduce air leaks in your HVAC system and limits the amount of unfiltered air entering your home.
Put a fresh filter in before June. Choose MERV 13, or the highest rating your system can handle.
On orange days or worse, close the windows and switch the thermostat fan from Auto to On so air keeps moving through the filter.
Check the filter after each major smoke event, and swap it once it turns gray.
Keep a portable HEPA air cleaner running in the room your family uses most.
It takes little effort for a big payoff, and it's the kind of job the hero of a household finishes before anyone else notices the haze. An HVAC technician can help make sure your system is ready to keep indoor air cleaner when outdoor air quality gets worse.
"Every smoke week, I pull filters that turn gray within days, because a running blower draws smoky air in through each leaky return and attic gap in the house. Your AQI history tells you which months to expect, so I tell families to install a fresh MERV 13 before June instead of waiting for the first alert."
7 Essential Resources
Live AQI Minneapolis Tracker: Check today's reading, sign up for unhealthy-air alerts, and match your filter to the AQI.
EPA Air Quality Index Daily Values Report: Pull daily AQI for Hennepin County or the Twin Cities metro in any year.
AirNow AQI Basics: See what each of the six color categories means for your health.
City of Minneapolis Air Monitoring Dashboard: Browse neighborhood sensor history from summer 2022 forward.
National Weather Service Air Quality Safety: Learn how forecasters predict ozone and particle pollution.
CDC: How Wildfire Smoke Affects Your Body: Find out who faces higher risk when smoke rolls in.
MPR News July 2026 Weather Recap: Read how heat and drought fed the worst air quality ever measured in Minnesota.
3 Supporting Statistics
Minnesota issued 7 orange-level air quality alerts in 2018. In 2023, it issued 37 orange and 12 red alerts. Minnesota Pollution Control Agency: The Air We Breathe 2025
During the July 2026 smoke outbreak, a sensor in Blaine recorded 342.8 µg/m³ of fine particles, a provisional record for the Twin Cities area. Minnesota DNR State Climatology Office
The Minneapolis-St. Paul metro ranked 39th worst in the nation for short-term particle pollution, and Hennepin County averaged 4.5 unhealthy days a year from 2022 to 2024. American Lung Association 2026 State of the Air
Minnesota's air quality has become a growing concern, with more pollution alerts in 2023 than in 2018. During July 2026, wildfire smoke brought record levels of fine particles to the Twin Cities, while Minneapolis-St. Paul ranked 39th worst in the nation for short-term particle pollution. In areas where homeowners spend the most on housing, indoor air quality remains another important factor in keeping homes healthy and comfortable.
Final Thoughts and Opinion
Here's my honest take. Most people check air quality on the day it goes bad, and by then the useful decisions are behind them. Spend a few minutes in the archive each spring instead. You'll learn which months bring trouble, how rough the last few seasons got, and whether your neighborhood runs worse than the metro. After 2025 and July 2026, I treat the historical AQI Minneapolis record like an almanac for my lungs. Use it to set your filter schedule and your family's smoke plan while the sky is still clear, and you'll be the hero of your household on the worst air days.
Frequently Asked Questions
How Far Back Does Minneapolis AQI Data Go?
EPA AirData's annual AQI summaries go back to 1980. The MPCA widened its sensor coverage in the 2010s, and the city's neighborhood sensors start in summer 2022.
What Is the Worst AQI Minneapolis Has Recorded?
Smoke from fires near the Boundary Waters pushed the Twin Cities into the maroon Hazardous category, 301 and above, for the first time in July 2026. The MPCA is still confirming final record values.
Is Historical AQI Data for Minneapolis Free?
Yes. The MPCA tool, EPA AirData, and the city dashboard cost nothing, and the EPA lets you download daily values as a file.
Why Do Sites Show Different AQI Numbers for the Same Day?
Live maps show hourly NowCast values, but archives store 24-hour daily values. Monitors and low-cost sensors also read differently, and provisional numbers can shift once certified data arrives.
How Often Do the Twin Cities Get Air Quality Alerts?
That swings a lot from year to year. Minnesota issued 7 orange alerts in 2018 and 49 alerts in 2023, and wildfire smoke now drives most of them.
Can Historical AQI Data Help Me Choose a Furnace Filter?
Yes. If your records show smoky summers or winter inversion weeks, install a MERV 8 filter, or the highest rating your system supports, before those months arrive.
Know Your Minneapolis Air History Before the Next Smoke Season
Pull last summer's daily AQI values from EPA AirData or the MPCA tool, circle the months that ran orange or worse, and schedule your filter change ahead of them. Pair that habit with a quick look at the live reading on hazy mornings, and you'll have past and present working together so your household breathes easier. Choosing top air filters designed to capture fine particles helps keep indoor air cleaner during periods of poor outdoor air quality.